Filtering and Drilling Down
There are a number of ways to interact with the data on Open FI$Cal to get to just the subset of data you are interested in. Some of the most useful ways are described below:
-
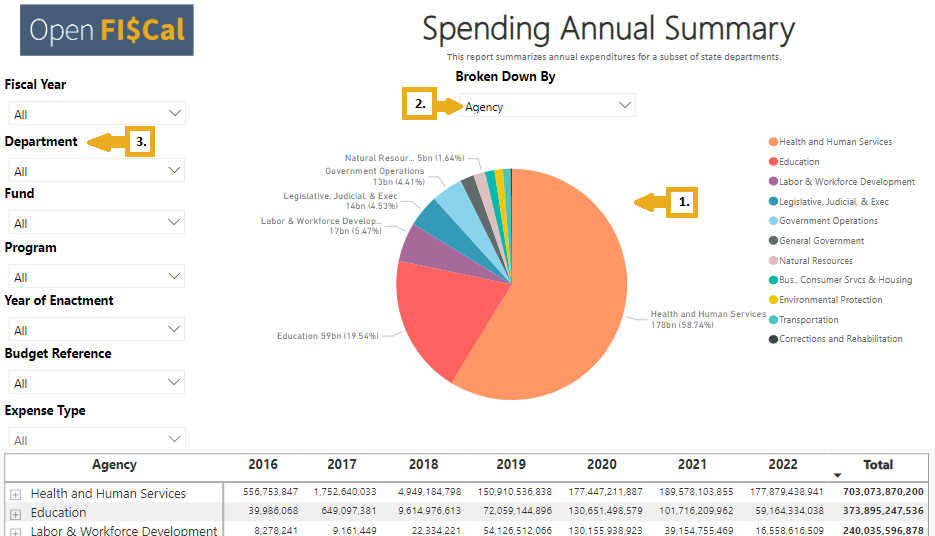
Click or Tap on the Charts: In the Spending Annual Summary and Spending Monthly Summary reports (the “Summary” reports), click on a section of a chart or a name in the chart’s legend to select that category. If there is a lower level in the hierarchy for the data displayed, the chart will drill down to the next lower level. So for example, if the chart is showing state agencies, and you select “Health and Human Services”, the chart will show you the departments that make up the Health and Human Services agency.
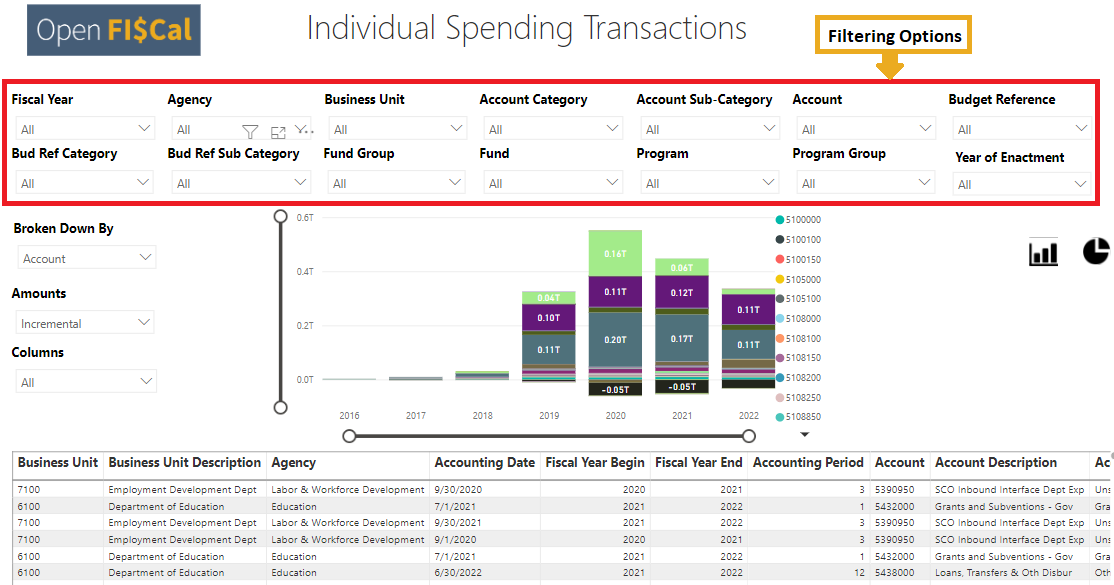
Selecting an area of a chart in the Spending Transactions or Vendor Transactions report (the “Transaction” reports) will select that category, but will not automatically show the lower level of the hierarchy (you will need to go to “Broken Down By”—see below).
-
Use “Broken Down By”: One of the most useful ways to interact with the data on Open FI$Cal is to see the same set of expenditures broken down in different ways. To do this, select the “Broken Down By” dropdown menu. In the Summary reports, you can break reports down by the six categories of information that have a hierarchy. So for example, if you have filtered down to just the expenditures of the Judicial Branch, you can then view how those expenditures break out by fund, by program, or by account, by selecting the appropriate items in the menu.
In the Transaction reports, you can break reports down by almost all of the fields in the data, giving you great flexibility but adding complexity.
-
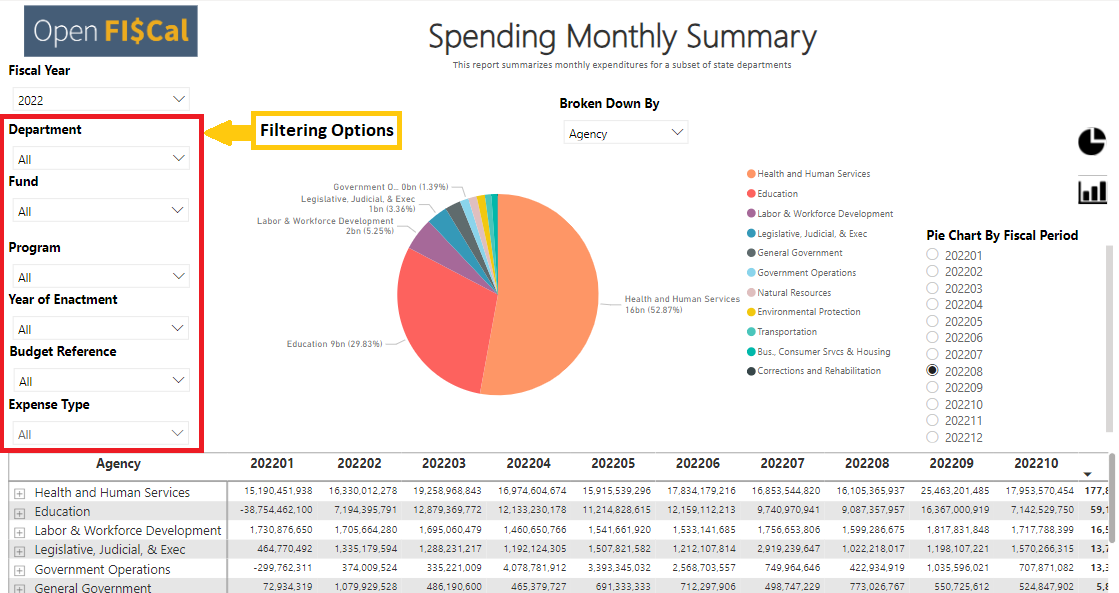
Use the Filtering Options: If you need more advanced filtering abilities than you can get by clicking on the charts—for example, if you want to select two departments simultaneously—use the "Department" filter. The filtering options are displayed differently in the Summary and the Transaction reports.
- In the Summary Reports, all filtering options are on the left side of the page. Selecting each filter category will open a drop down menu. For example: the “Department” filter will offer a drop down menu with all available department names while the “Fund” filter will offer a drop down menu with all available fund types.
- In the Transaction Reports, most filtering options are at the top of the page. Additionally, the “Broken Down By”, “Amounts”, and “Columns” filter are to the left of the data chart. Only the Individual Transaction Reports offer the “Amounts” and “Columns” filters.
- Amounts – This allows you to change the chart view to display dollar amounts incrementally or cumulatively.
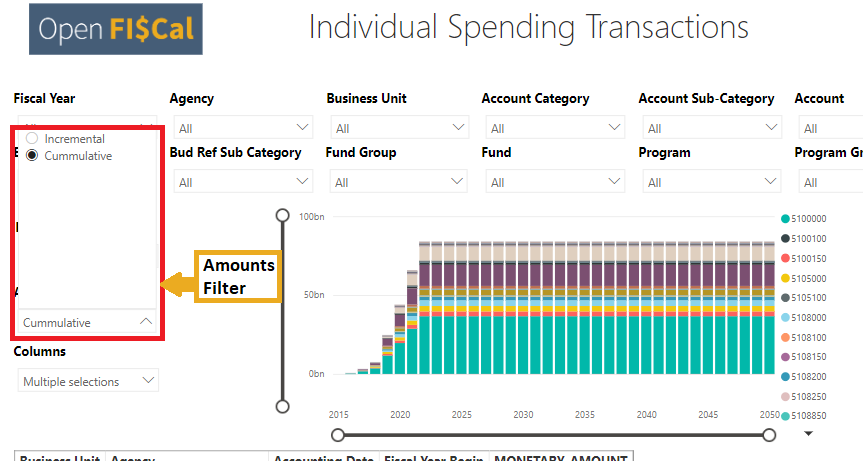
- Columns – This allows you to add and remove columns from the table at the bottom of the page.
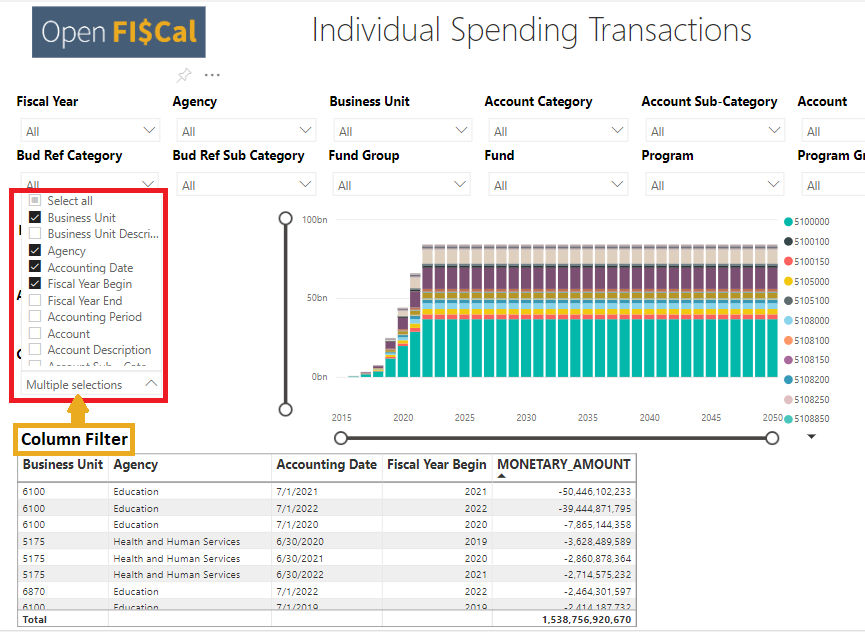
- Amounts – This allows you to change the chart view to display dollar amounts incrementally or cumulatively.